Zoetrope has a zoomable canvas, through which the user can view past versions as well.
Below is a screenshot of Zoetrope in action.
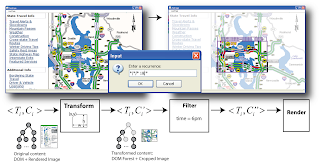
The lenses can be used to have filters
The one above is a temporal lens, which allows a user to easily go through past versions of the page, focused on this area. This one is specifically for viewing traffic patterns. Various types of temporal lenses include: Visual Lenses, Structural Lenses, Textual Lenses. The visual lenses are like a cropping transform. Structural Lenses find all DOM inside the selection. Textual Lenses can track either exactly or approximately the same text, and tracks it's position on the page. The paper uses the example of tracking a sports teams ranking.
Filters can be applied to lenses. The filters can be done based on time, keywords, amounts, duplicate elimination, and combinations of filters, and trigger filters.
People would often want to combine various lenses, they can be bound together. All the sliders and other controls on the lenses are bound toghether as well.
Lenses can also be stacked, the paper sites the example of filtering for clear weather, and then introducing another time constraint of being between 6-7pm daily.
Despite all this data collection, one of the most important part has yet to be discussed, and that is the visualization side of Zoetrope. The simplest of these visualization methods is the timeline, which displays images data on a time axis. A similar manifestation would be the movie, which is a cycling of images, transitioning smoothly between them, similarly to a slideshow. Other types including clustering data onto tables, and time series, which allows for analysis of numeric data, like prices of books, or people at an event.
One of the nice benefits of Zoetrope is that much of the data can be exported to a google spreadsheet for further analysis.
It's a pretty interesting tool, and the team is looking forward in different expansions it could do to increase performance, as well as lower storage costs.
It looks pretty cool to me,
The full paper is at
http://srl.csdl.tamu.edu/courses/CHI2009/papers/uist08/UIST08_28_Adar.pdf
The full paper is at
http://srl.csdl.tamu.edu/courses/CHI2009/papers/uist08/UIST08_28_Adar.pdf
No comments:
Post a Comment